

How Manufacturing Companies Use AI to Improve Operations: 8 Uses and the Data Each Needs
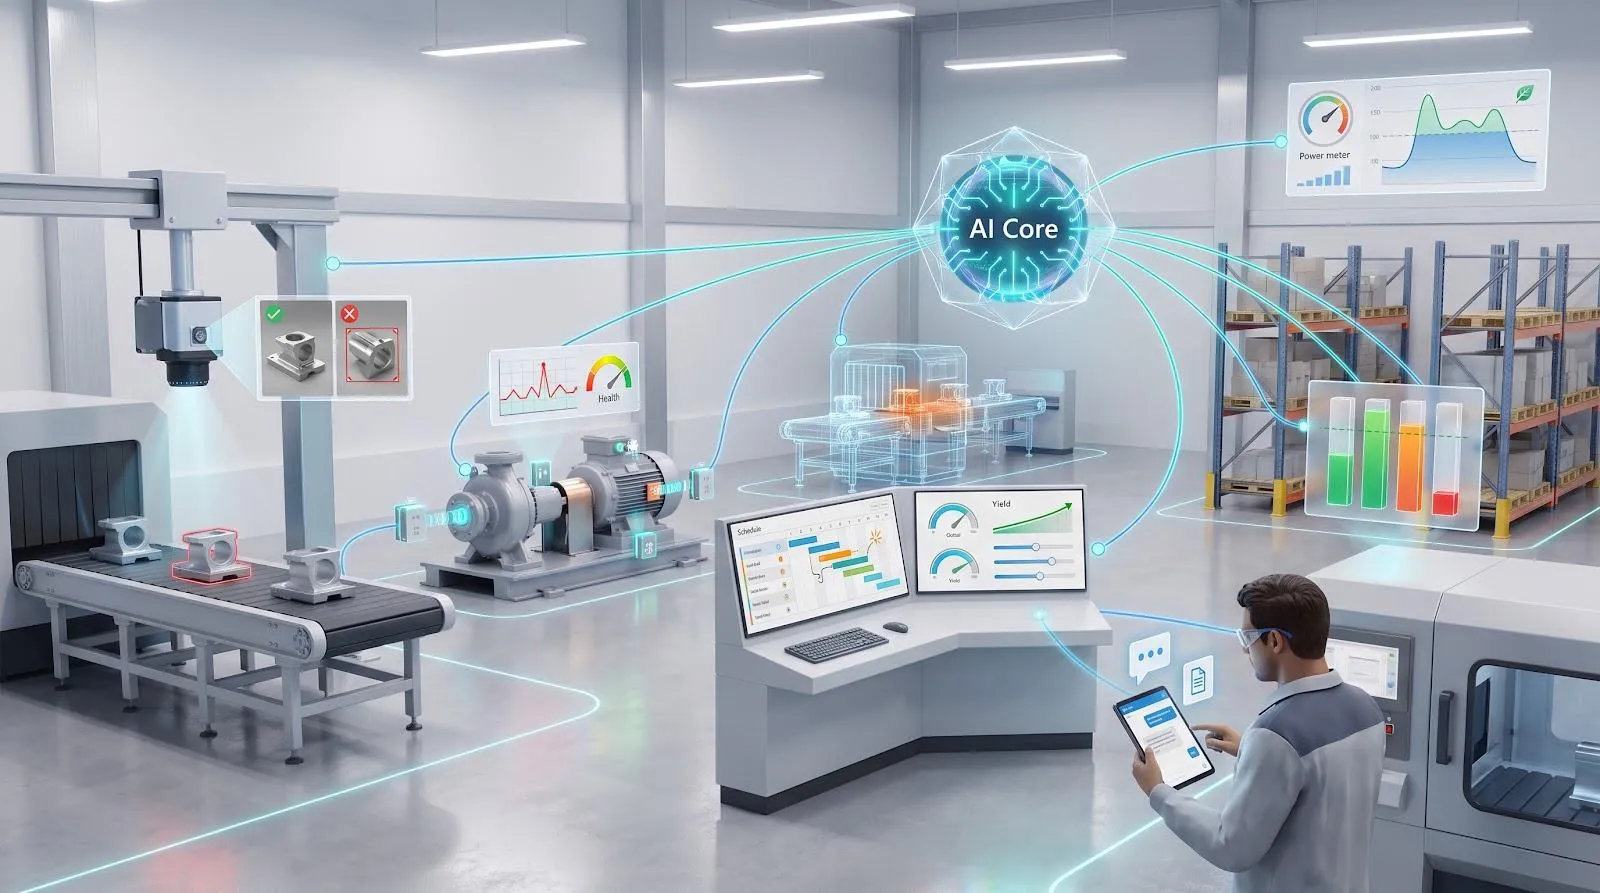
Most factories already see AI pay off, but few repeat the trick at scale. According to Deloitte’s 2026 AI in Manufacturing survey, 84 percent of manufacturers report measurable value from AI, yet only about one in five use cases has been scaled consistently across sites or enterprise-wide. This guide helps you close that gap. We’ll dissect eight proven factory-AI plays, spell out the minimum data each one needs, flag the KPIs to baseline, and share field-tested results. Use the checklist to price the pain, audit your data, assign an owner, and then decide whether to scale or shelve a pilot.
Quick-pick matrix: match the problem, data, and payback
Use the matrix below to sanity-check any idea in under a minute:
Find the pain that matches your plant.
Make sure you already capture the minimum data in a traceable way.
Check the typical payback window reported by Lighthouse sites and Deloitte’s 2026 survey.
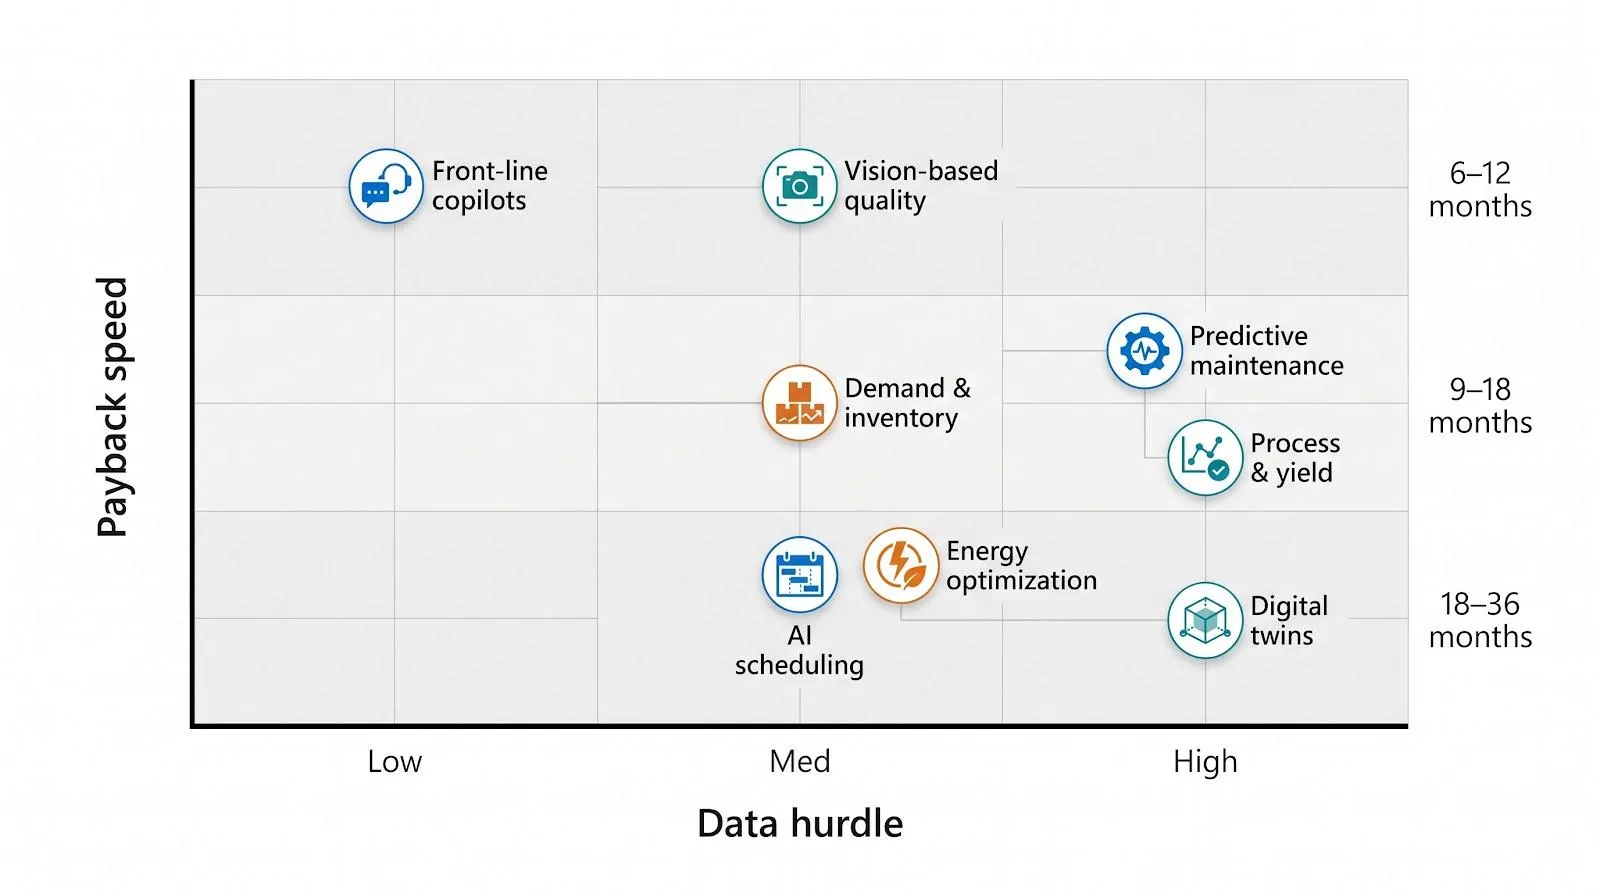
Use case | Primary value lever | Minimum data to start | Data hurdle* | Typical payback† |
Vision-based quality inspection | Scrap, defect escapes | Labeled good and bad images tied to SKU / lot | Med | 6–12 mo |
Predictive maintenance | Unplanned downtime | Vibration, temperature, failure history, CMMS links | High | 9–18 mo |
Process and yield optimisation | Material cost, throughput | Historian tags, recipes, lab results | High | 9–18 mo |
AI-driven production scheduling | On-time delivery, WIP | Orders, BOMs, routings, live machine status | Med | 12–24 mo |
Demand and inventory forecasting | Working capital, service level | Orders, inventory, supplier lead times | Med | 9–18 mo |
Front-line copilots and agents | Technician hours, MTTR | Current SOPs, manuals, error-code docs | Low | 6–15 mo |
Digital twins and virtual commissioning | Engineering hours, launch risk | 3-D models, cycle times, layout data | High | 18–36 mo |
Energy and emissions optimisation | Utility cost, CO₂ | Interval meters, machine states, tariffs | Med | 9–24 mo |
*Low = data already lives in documents or standard systems; Med = some integration or label work; High = new sensors or extensive contextualisation.
†Payback windows are conservative ranges aggregated from Global Lighthouse Network case data and McKinsey research (average implementation takes 10–20 months, and ROI typically arrives within three years).
Remember, a low data hurdle doesn’t always equal the fastest return, and the shiniest tech can carry the slowest payback. That’s why every project begins with two checks: does the cost sting enough, and is your data already trustworthy?
Eight proven AI use cases
1. Automated visual inspection: spotting defects the human eye misses
Cameras never blink. When a high-resolution vision system feeds an image-classification model, surface scratches, dents, and missing components are caught in milliseconds, before they snowball into scrap or recalls.

How it works
Cameras fire at line speed. The model compares each frame with thousands of tagged “good” images and a curated library of confirmed defects. If confidence drops below a set threshold (many plants start around 95 percent), the unit diverts for review or rework. A technician confirms or corrects the alert, and that fresh label rolls back into training so accuracy climbs shift after shift.
Data you need
Well-lit images you label pass or fail, linked to SKU, lot, and camera settings
Optional context - tool wear, machine speed, rework outcome - helps explain why defects appear, not just that they do.
What plants report
CITIC Dicastal’s Moroccan wheel factory cut defects 31.1 percent and raised OEE 17 percent after scaling AI-guided inspection across multiple lines.
Pilot tip
Pick one stable, high-volume SKU. Run the model in “shadow” mode for two weeks, track false rejects and false negatives separately, and tune lighting before blaming the algorithm. Always leave a human override for edge cases no dataset can cover.
2. Predictive maintenance: fix the asset before it breaks
A single seized pump can shred today’s schedule and tomorrow’s promise date. Time-based maintenance swaps parts on faith, while predictive maintenance listens to the machine itself.
How it works
Edge sensors sample vibration, temperature, acoustics, and load, often at 1 kHz or faster, then push the data to a historian.
An anomaly model learns each asset’s healthy fingerprint and flags drift in seconds.
A failure-prediction model, trained on recorded breakdown events, estimates remaining useful life in hours. The alert lands in the computerised maintenance-management system (CMMS) so planners can slot the job into the next planned stop.
Data you need
Clean, time-synced sensor feeds covering at least three months
Confirmed failure timestamps and modes
A CMMS hierarchy that ties every work order to the exact asset ID; one orphaned tag can poison the model
What plants report
Jubilant Ingrevia wired its reactors and utilities into IoT digital twins and predictive platforms across more than thirty use cases, cutting overall process variability 60 percent and nearly doubling production volume.
Pilot tip
Choose one bottleneck machine where every lost minute hurts revenue. Run the system in watch-only mode for four weeks, tune the alert threshold (typical first pass: 95 percent anomaly confidence), then let planners act. Track mean time between failures weekly, and celebrate when the curve turns upward.
3. Process and yield optimisation: squeeze more good parts from the same line
Every shift, operators tweak temperatures, feed rates, and pressures, variables that push yield, scrap, and energy in directions no one can juggle mentally. A multivariate machine-learning model can.
How it works
Aggregate data – Pipe historian tags, set-point changes, and lab results into a time-aligned table; one row per minute is common for batch lines.
Train the model – Spot variable combinations that precede scrap spikes or “golden runs” with near-zero defects.
Recommend settings – A real-time engine proposes the next best set-point before the batch starts. Engineers accept or adjust, and every decision flows back into training.
Evidence
Turkish appliance maker Beko applied this loop to its sheet-metal line, where a machine-learning control system adjusts forming parameters in real time. Material cost per unit fell 12.5 percent and a decision-tree model that catches sheet-thickness variation cut clinching defects 66 percent. The same approach on plastic injection molding trimmed cycle time 18 percent on one part.
Data to start
Capture about a dozen high-influence tags at one hertz or faster, each stamped with batch and product IDs; that small set often explains about 80 percent of process variance.
Pilot tip
Run the recommender in parallel for two to four weeks. Let engineers review each suggestion, then enable closed-loop control only after guardrails are documented and approved.
4. AI-driven production scheduling: turn weeks of guesswork into a daily plan
A frozen two-week schedule collapses under rush orders, machine hiccups, and late trucks. An AI scheduler ingests live orders, machine calendars, setup matrices, and labour rosters, then rebuilds the plan every ten minutes so the shop floor always runs the highest-value job.
How it works
A constraint solver explores thousands of feasible sequences.
A machine-learning layer refines cycle-time estimates from actual run data.
The result lands in the planner’s inbox: accept or tweak? Every tweak teaches the system where tribal knowledge still hides.
Evidence
Hindustan Unilever’s Tinsukia plant combined machine-learning planning with AI-guided changeovers, cutting its frozen window from 14 days to 1 day, tripling the SKUs it can juggle, and trimming sustainable-packaging trial time 84 percent.
Data to start
Orders and routings from ERP, real-time status from the manufacturing-execution system, and standard setup times from line sheets are enough for a pilot.
Pilot tip
Let the model propose tomorrow morning’s sequence. If it beats the hand-built plan three days in a row, go live, then measure schedule adherence and expediting cost every week.
5. Demand and inventory planning: balance stock, service, and cash
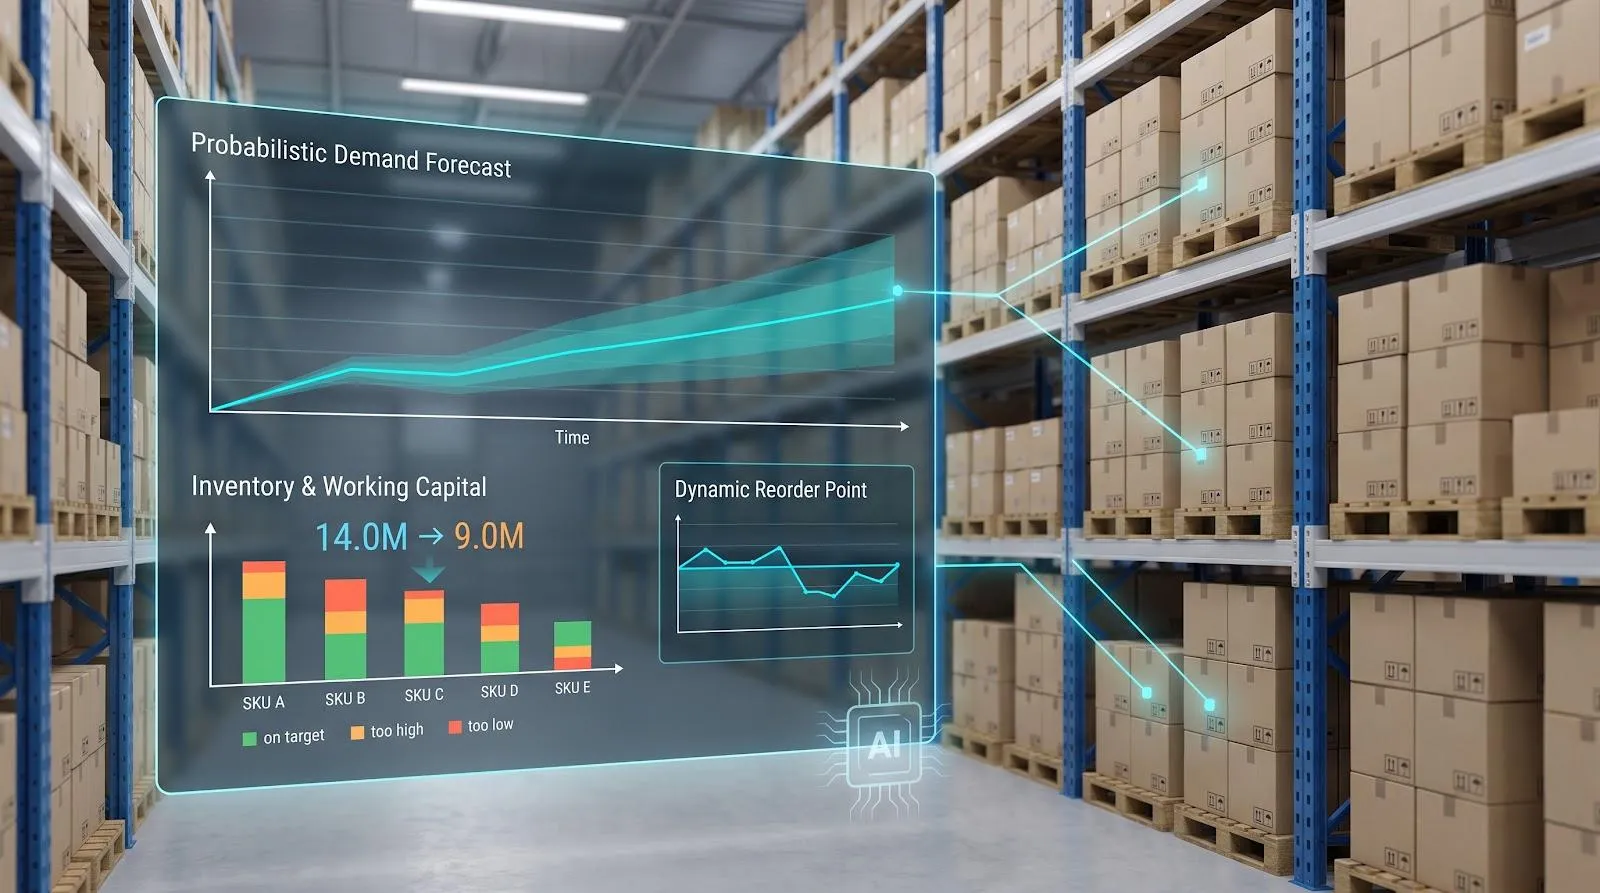
Monthly forecasts breed firefighting, while an AI planner runs every night and produces a probabilistic demand curve instead of one risky point. An optimiser then sets safety stock and planned order sizes that flex with risk rather than gut feel.
Evidence
Guizhou Tyre adopted AI-driven forecasting and inventory rules and cut on-hand stock 34 percent while boosting quality and productivity. Demand Genius™ - part of MCA Connect’s portfolio of AI & industry agents for manufacturing - pairs anomaly-aware demand forecasting with a Safety Stock Agent that optimises safety stock levels from those forecasts and planning triggers. MCA Connect reports the tool lifts forecast precision by up to 20 percent, cuts stockouts 25 percent, and reduces excess inventory 30 percent, and it has run on carbon-fiber composites production for the aerospace and industrial markets.
Start small
Pick ten high-value SKUs. Feed the model two years of sales data plus rolling supplier on-time-in-full data. Let it recommend reorder points for the next quarter. Track two KPIs: production shortages and working capital tied up in raw materials. When both improve, extend to the next product family and shorten the forecast refresh to twelve hours if needed.
6. Front-line copilots and agents: put hard-won knowledge at everyone’s fingertips
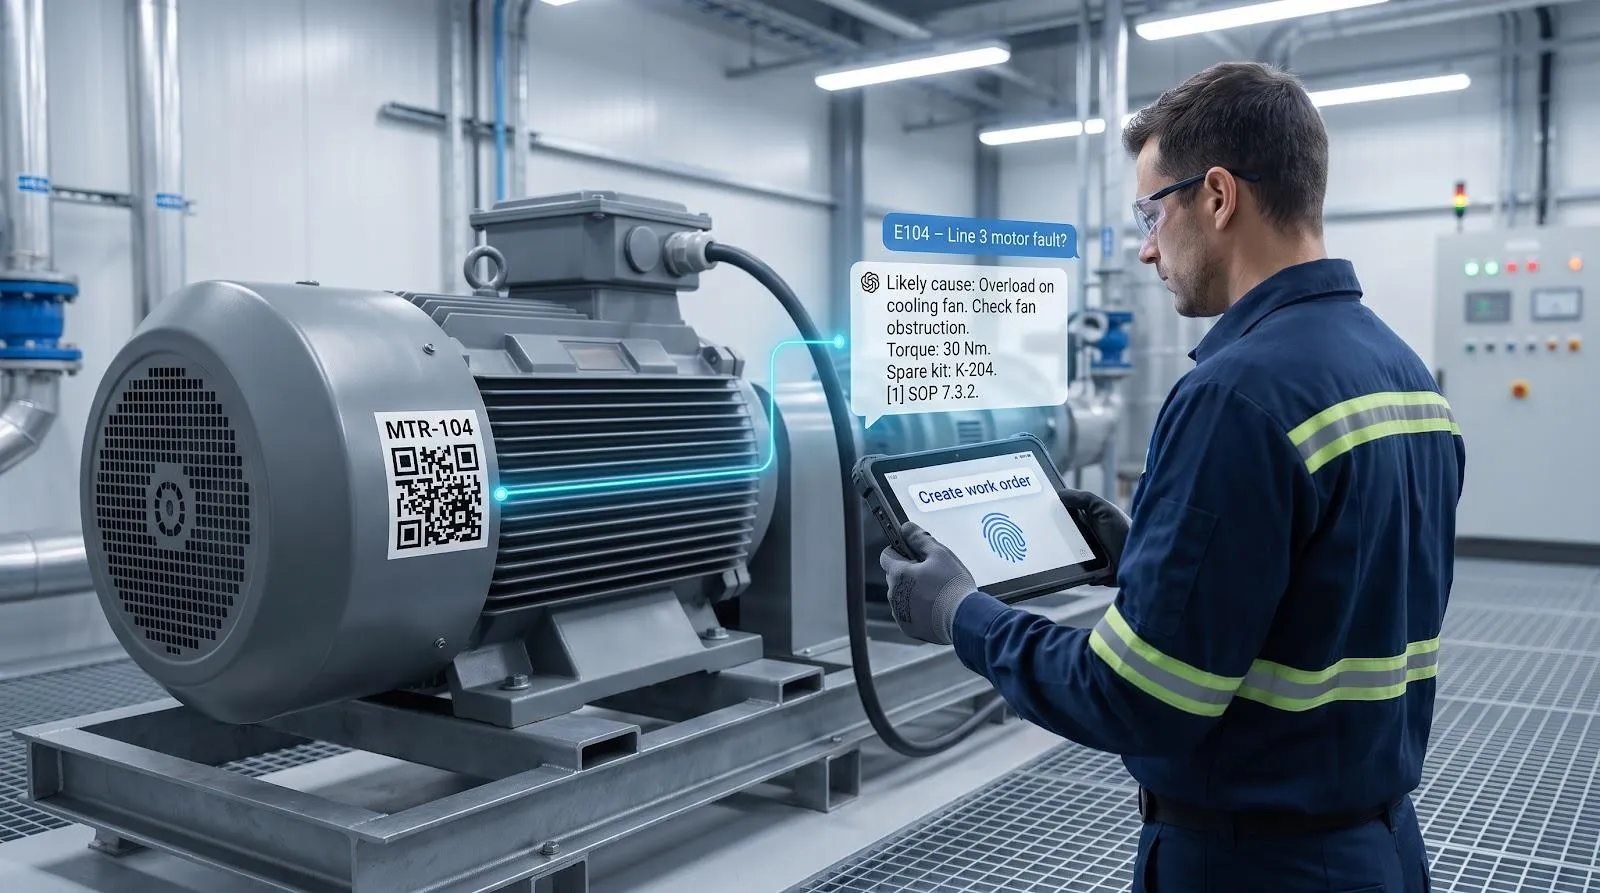
Shift logs and manuals often hide the fix for a stubborn alarm, yet technicians spend minutes paging through binders or aging PDFs. A shop-floor copilot pairs a large language model with retrieval from approved standard operating procedures (SOPs), manuals, and past work orders, then replies in plain language while citing the exact source paragraph.
How it works
Scan a QR code on the motor, enter or speak the error code, and the copilot returns the likely root cause, correct torque spec, and spare-kit number.
Tap once to convert the answer into a pre-filled work order, trimming paperwork to seconds.
Evidence
Early deployments report the same two effects: less time spent hunting through manuals and shift logs, and fewer repeat visits because the right torque spec and spare-kit number arrive on the first try. Baseline technician hours and mean time to repair before launch so you can size the gain rather than take a vendor’s word for it.
Data to start
Current SOPs, error-code tables, and a clean asset hierarchy matter more than terabytes of sensor data.
Guardrails
Answers must carry citations, and any action that changes a machine state needs a human thumbprint until accuracy is proven.
Pilot tip
Begin with retrieval only. Log every question, answer, and user correction for a month. When corrections fall near zero, allow the agent to draft the work order; execution autonomy can wait for phase two.
7. Digital twins and virtual commissioning: test in the cloud, not on the line
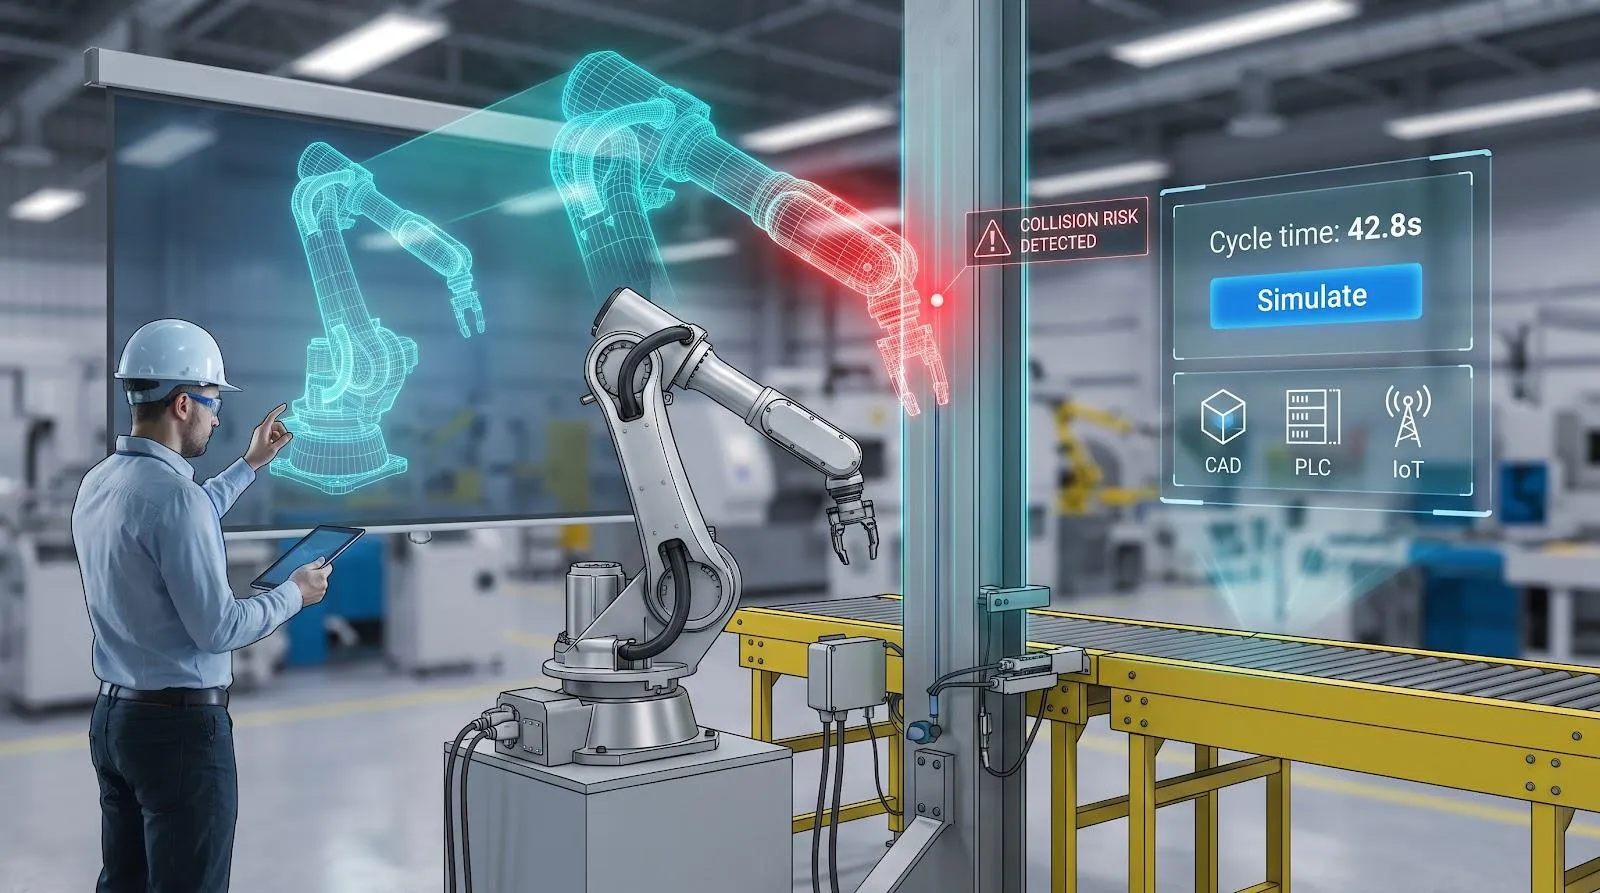
A paper layout is cheap until forklifts roll in and a robot arm collides with a column. A plant-scale digital twin avoids that cost. Feed the model with CAD geometry, cycle times, programmable logic controller logic, and live IoT traces, then press simulate. Collisions, bottlenecks, and even airflow issues appear weeks before steel is cut.
Evidence
BMW’s virtual collision check now takes three days instead of nearly four weeks and is projected to trim overall planning costs up to 30 percent across more than thirty plants.
Data and pilot path
The data load is heavier than earlier use cases: engineering geometry, MES sequencing, and sensor traces to validate behaviour. Start with one high-risk change, such as a gripper path or conveyor reroute, and mirror it in the twin. When the virtual cycle time matches reality within plus or minus five percent, sign off the design and build.
After launch
Stream live signals back into the twin, compare predicted versus actual throughput each shift - daily refresh is common - and let the model suggest micro-tweaks that nudge OEE upward without pausing the line.
8. Energy and emissions optimisation: cut kilowatts without cutting throughput
Energy hides in overheads until a demand spike or an ESG goal pushes it into the spotlight. An AI load planner treats those line items as levers, forecasting demand at machine, line, and plant level, then nudging set-points or shifting non-critical runs to shave peaks and shrink the carbon footprint.
How it works
Interval-meter data and machine states feed a load-forecast model at fifteen-minute granularity. An optimiser weighs tariff tiers, production urgency, and quality limits, then recommends when to fire ovens, idle compressors, or run night shifts. Digital twins of furnaces or heating-ventilation-air-conditioning loops refine the target window.
Evidence
Valeo’s Shenzhen plant embedded energy AI in a forty-two-use-case programme and cut unit energy 27.1 percent while lifting productivity just over 60 percent.
Pilot tip
You seldom need a sensor on every motor. Start with the biggest utility hog, often compressed air or a reflow oven. Log hourly power for a month, correlate it with production volume, then hunt for idle periods or off-peak windows. A simple control, such as auto-shutting compressors when pressure tops 7 bar (about 100 psi) during lunch, often pays back in under a year. Prove the rule on one line; finance will back the plant-wide roll-out when the meter shows the savings.
The 90-day playbook: from pilot talk to proven value
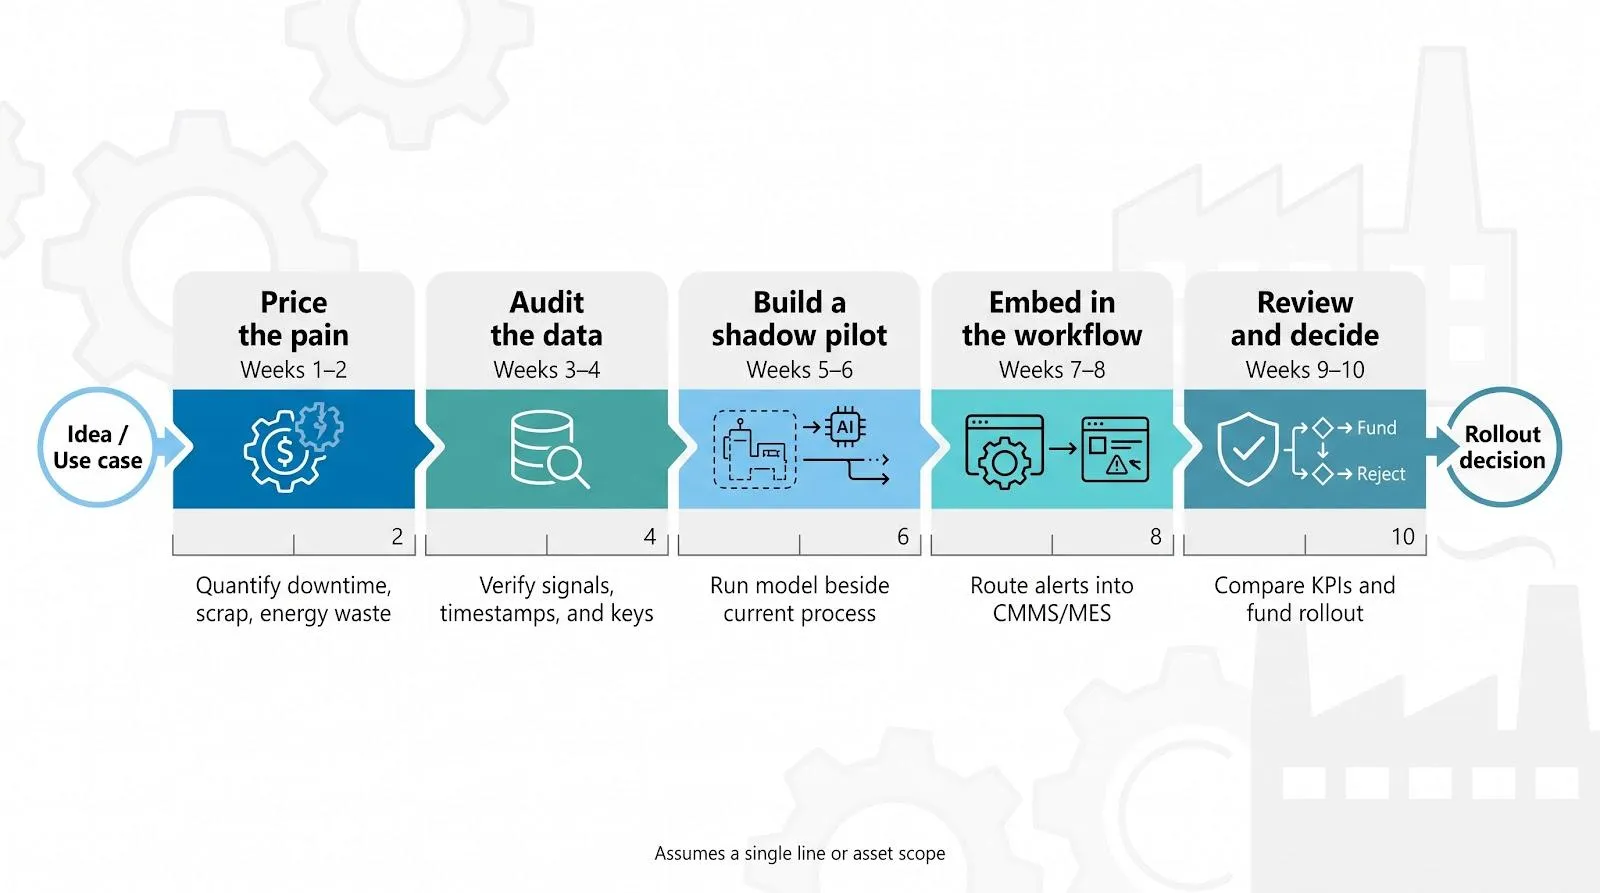
Use this ten-week sprint to move any of the eight use cases from idea to funding decision.
Week | Focus | What to do | Typical effort* |
1 – 2 | Price the pain | Put a dollar tag on downtime, scrap, or energy waste. Agree on one target KPI and one guard-rail KPI. | 4–6 hours with finance and operations |
3 – 4 | Audit the data | Confirm each required signal exists, is time-stamped, and links to lot, asset, or order. One missing key can stall a model. | 1 data engineer, 1 process owner |
5 – 6 | Build a shadow pilot | Run the model beside the current process with no automatic actions. Track accuracy, false positives, false negatives, and user feedback. | 1 data scientist, 1 line engineer |
7 – 8 | Embed in the workflow | Route alerts into the computerised maintenance-management system (CMMS), manufacturing-execution system (MES), or planner screen already in use. Log every accept and override. | 1 integration engineer |
9 – 10 | Review and decide | Compare KPI shifts, user acceptance, and recurring cost. If results beat your hurdle rate, fund rollout and publish the data schema for the next plant. | Steering-team review |
*Effort assumes a single line or asset. Multiply by scope for larger pilots.
Repeat the cycle: every new use case reuses the data contracts, security model, and deployment pipeline you just built, cutting the next site’s lead time by roughly half.
Conclusion
AI in manufacturing already delivers measurable gains, but scaling success demands a disciplined pilot-to-production playbook. By matching pain points to data readiness, proving value in shadow mode, and embedding models in daily workflows, plants can turn isolated wins into repeatable enterprise impact.